

Brainstorm
Are you struggling to capture your audience's attention online? In a world saturated with information, visual content reigns supreme. Infographics are powerful tools to convey complex information quickly and engagingly. However, simply creating an infographic isn't enough. To truly stand out and drive organic traffic, it needs to be optimized for search engines.
This comprehensive guide will walk you through everything you need to know about SEO infographics, from strategic design to robust promotion. We will explore the best practices, essential tools, and current trends to help you create infographics that not only look great but also rank high, attract quality backlinks, and ultimately boost your search visibility and business goals.
This article covers search optimization and promotion. For layout, accessibility, and chart selection, use the infographic design guide. For platform formats and social calls to action, use the social media infographic guide.

What is an SEO Infographic?
An SEO infographic is a visually compelling graphical representation of information, data, or knowledge. It is specifically designed and optimized to rank high in search engine results pages (SERPs). These infographics combine engaging graphics with concise text to explain complex topics in an easy-to-digest format.
Unlike traditional infographics, an SEO infographic integrates search engine optimization best practices throughout its creation. This includes careful consideration from topic selection and keyword research to the design, embedding, and promotion phases.
How do infographics boost SEO?
Infographics can significantly boost SEO efforts in several ways, leveraging their visual appeal and shareability. They are designed to attract inbound links and improve user engagement metrics, both of which are crucial for search engine ranking.
-
Infographics attract backlinks, which are a key ranking factor for search engines.
-
They increase dwell time on a page, signaling to search engines that the content is valuable.
-
Infographics improve social shares, expanding content reach and brand visibility.
-
They enhance the overall user experience by presenting information clearly and engagingly.
-
Their highly shareable nature leads to viral potential and increased brand exposure.
Why is visual content important for search?
Visual content is crucial for search primarily because it improves content readability and comprehension. It caters to various learning styles, making information accessible to a wider audience, and helps reduce bounce rates as users are more likely to stay on a page that offers engaging visuals. This aligns with search engine algorithms that prioritize user engagement. Studies show that visual content is processed 60,000 times faster than text, making it highly effective for capturing attention in a competitive online landscape. [1]
What are the Core Strategies for SEO Infographics?
Developing effective SEO infographic strategies involves several key components, from meticulous keyword targeting to optimizing visual design and strategic embedding. Understanding these elements helps ensure your infographics not only inform but also rank well in search results.
How does keyword targeting help?
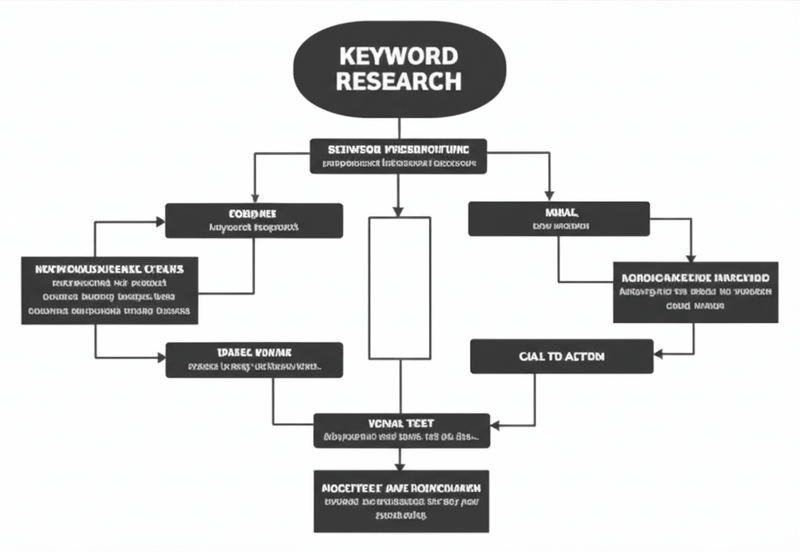
Keyword targeting helps an SEO infographic by connecting your content with relevant search queries. You should research keywords with high search volume but low competition using tools like Ahrefs, SEMrush, or Google Keyword Planner. Integrate these selected keywords naturally into the infographic's title, its file name, image alt text, description, and any surrounding text on the page. Focusing on longer, more specific long-tail keywords can improve targeting precision. Analyzing competitor infographics also reveals keyword gaps and new opportunities.
What makes a design SEO-friendly?
An SEO-friendly design for an SEO infographic prioritizes both visual appeal and clear communication of information. The design should be visually appealing and easy to understand, effectively conveying complex data. Use clear fonts, maintain a consistent color scheme, and incorporate appropriate charts and graphs to visualize data. Prioritize clear and concise data visualization, using high-quality imagery and graphics. Ultimately, the design should remain clean and uncluttered, allowing for easy comprehension and an enhanced user experience relevant to search engine optimization.
Why is embedding crucial?
Embedding an SEO infographic is crucial because it allows the infographic to be hosted on your site while being shared and displayed on other relevant platforms. This process involves using descriptive file names, providing detailed alt text for images, and implementing schema markup. For instance, use keywords in the file name, such as "keyword-infographic.png." The alt text for each image should describe its content and incorporate relevant keywords. Additionally, using schema markup, like JSON-LD, provides search engines with structured data about your infographic, further improving its visibility and understanding by search engines.
Which Tools and Techniques Aid SEO Infographics?
Creating impactful SEO infographics relies on a combination of effective tools and strategic techniques. These resources help you design compelling visuals, optimize them for search engines, and successfully promote them to your target audience.
What design tools are recommended?
Several design tools simplify the infographic creation process, each offering unique strengths. The choice depends on your expertise and specific needs.
-
Canva: This platform is user-friendly, providing numerous templates and a drag-and-drop interface for ease of use.
-
Adobe Illustrator: For professional designers, Illustrator offers precise control and excellent scalability for high-quality graphics.
-
Piktochart: This tool focuses on data visualization and includes options for interactive elements.
-
Visme: Visme is a versatile option, supporting animation and providing analytics features.
Effective design techniques are crucial for making infographics digestible and engaging.
-
Employ clear and concise messaging by using bullet points and short sentences to convey information quickly.
-
Utilize data visualization through charts, graphs, and maps to represent complex data visually.
-
Ensure a visually appealing design with high-quality images, consistent color schemes, and an organized layout.
-
Adopt a storytelling approach to weave a narrative around your data, making it more relatable and memorable.
Which SEO tools are essential?
SEO tools are indispensable for ensuring your infographics rank well and reach a wider audience. They assist in keyword research, performance monitoring, and competitor analysis.
-
Google Keyword Planner: This tool is useful for conducting thorough keyword research to identify relevant terms.
-
SEMrush: SEMrush offers a comprehensive SEO toolkit, including competitor analysis features.
-
Ahrefs: Ahrefs excels in keyword research and in-depth backlink analysis.
-
Google Search Console: This platform helps monitor your infographic's performance and identify any technical issues.
Implementing specific SEO techniques will enhance the visibility of your infographics.
-
Perform keyword optimization by strategically placing keywords in the title, description, alt text, and file name of your infographic.
-
Use schema markup to provide structured data that helps search engines understand your content better.
-
Practice on-page optimization by integrating your infographic with surrounding content and linking it internally within your website.
-
Engage in link building through promotion efforts to earn valuable backlinks to your infographic.
How can promotion tools help?
After designing and optimizing your SEO infographic, effective promotion tools and techniques are necessary to maximize its reach. These tools help distribute your content across various platforms.
-
Social Media Platforms: Utilize platforms like Facebook, Twitter, LinkedIn, and Pinterest to share your infographics with a broad audience.
-
Email Marketing: Leverage email campaigns to inform your subscribers about new infographic content.
-
Content Marketing Platforms: Share your infographics on platforms such as Medium to tap into existing communities.
-
Influencer Marketing: Collaborate with influencers who can promote your infographic to their followers.
Strategic promotion techniques ensure your infographic gains traction.
-
Facilitate social media sharing by creating engaging posts that encourage viewers to share your infographic.
-
Conduct email promotion by featuring your infographic in newsletters and dedicated email blasts.
-
Pursue guest blogging opportunities where you can include a link to your infographic within your guest posts.
-
Participate in community engagement on relevant forums and online communities to share and discuss your infographic.
What Current Trends Impact SEO Infographics?
Several current trends significantly impact the effectiveness and reach of SEO infographics. Understanding these trends helps ensure your infographics perform optimally in search results and engage your target audience.
How do interactive elements help?
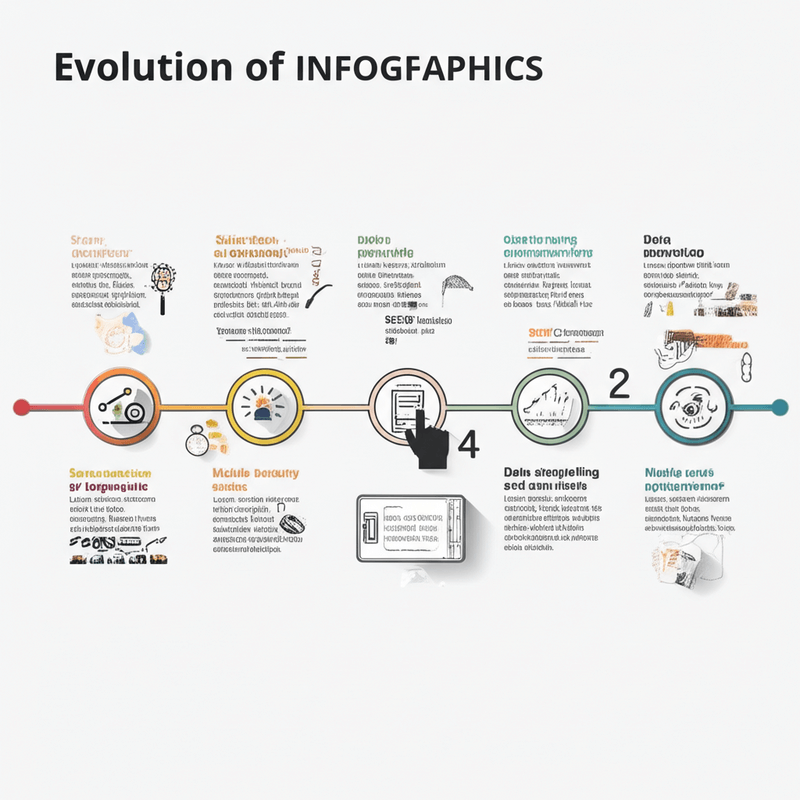
Interactive elements transform static infographics into dynamic experiences. Incorporating features like quizzes, polls, or clickable data points increases user engagement and extends dwell time on your page. This heightened interaction can lead to various monetization opportunities, including increased ad revenue, sponsored content placements, and effective lead generation. [2]
Why is mobile optimization key?
Mobile optimization is crucial for SEO infographics as many users access content on smartphones and tablets. Designing infographics specifically for seamless mobile viewing, ensuring readability and accessibility on smaller screens, significantly improves the user experience. This focus on mobile-first design leads toIncreased visibility in mobile search results, higher website traffic, and better overall user satisfaction.
How does data storytelling work?
Data storytelling leverages infographics to build a powerful narrative using data. This approach goes beyond simply presenting facts; it creates a more engaging and memorable experience for the viewer. By weaving a compelling story through visual data, infographics can significantly contribute to brand building and open doors for potential partnerships.
What are the Future Developments for SEO Infographics?
The landscape for SEO infographics is continuously evolving, with several key developments on the horizon that will reshape how they are created, consumed, and optimized. Expect to see significant advancements in automation, interactivity, and personalization, making these visual tools even more powerful for conveying information and enhancing search visibility.
How will AI change creation?
AI will transform infographic creation by automating significant aspects of the design and content generation process. This increased efficiency will make producing high-quality infographics faster and more accessible for a wider range of creators. The ability to scale production will allow businesses to integrate infographics more deeply into their content strategies without extensive manual effort.
What is AR's role?
Augmented Reality (AR) will introduce a new dimension of interactivity to infographics. Users will be able to engage with information in an immersive way, for example, by pointing their phone at an infographic and seeing data visualizations emerge in 3D. This will create a richer, more engaging user experience that goes beyond static images. [3]
How will personalization evolve?
Personalization in infographics will involve generating custom content tailored to individual user data and preferences. This means infographics could dynamically adjust to display information most relevant to a specific viewer, leading to highly individualized content marketing efforts. The goal is to deliver more targeted and impactful information to users.
Further developments will also include:

-
Voice-Search Optimization: Infographics will be optimized for voice search by integrating conversational language and relevant keywords. As voice search becomes more prevalent, ensuring infographics are discoverable through verbal queries will be crucial for their visibility.
-
Increased Use of Microdata and Schema Markup: Implementing structured data will help search engines better understand the content and context of infographics. This will improve how these visual assets are indexed and displayed in search results, potentially leading to rich snippets that enhance their prominence.
What Are Common Challenges with SEO Infographics?
Creating SEO infographics presents several challenges, beginning with the substantial upfront investment in both design and content. Producing a high-quality, visually engaging, and rigorouslyaccurate infographic demands significant time, resources, and often, specialized design expertise. This can pose a considerable hurdle, particularly for smaller businesses or those operating with more constrained budgets.
Another major obstacle lies in the effective promotion and distribution of the infographic. Merely publishing the content is insufficient; it necessitates active promotion across diverse channels to achieve visibility and secure valuable backlinks. This process involves strategic outreach, comprehensive social media campaigns, and potentially, paid promotional efforts, all of which are time-consuming and require a well-defined strategy. Furthermore, many creators struggle to make their infographics genuinely unique, risking low engagement if the topics are too generic or the designs uninspired, even with optimization efforts. Technical challenges like maintaining mobile responsiveness and fast loading speeds can also arise, as large image files may slow page load times, negatively affecting user experience and SEO.
Are design skills a barrier?
Yes, possessing adequate design skills can certainly be a barrier when creating SEO infographics. Developing a visually appealing infographic requires a strong understanding of graphic design principles, layout, typography, and color theory. Without these skills, or the resources to hire a professional designer, the infographic may appear unprofessional, significantly diminishing its ability to attract and engage an audience, regardless of the quality of its underlying data.
Is promotion difficult?
Promoting SEO infographics can indeed be difficult. After investing in creation, the next challenge is ensuring the infographic reaches its target audience and generates the desired impact, such as backlinks. This involves strategic planning for outreach to relevant websites, consistently sharing across various social media platforms, and potentially allocating budget for paid promotion. Without a robust promotional strategy, even the most compelling infographic may fail to gain sufficient visibility in a crowded content landscape.
How do I ensure data accuracy?
Ensuring the accuracy of data in an SEO infographic is paramount, yet it can be a challenging endeavor. The credibility and ultimate impact of an infographic are undermined if the information presented is incorrect or out-of-date. This necessitates meticulous research from reliable sources and precise citation of all data points, adding a layer of complexity and time commitment to the creation process. [4]
Frequently Asked Questions about SEO Infographics (FAQ)
How long should an infographic be?
The ideal length for an infographic varies, but it should be long enough to cover your topic comprehensively without overwhelming the audience. Aim for a balance between visual appeal and information density, often around 600-800 pixels wide and 2000-8000 pixels long, depending on the complexity of your data.
Can infographics be interactive?
Yes, interactive infographics are a growing trend in digital content. They allow users to click, hover, or otherwise engage with data points, revealing more information, animations, or even quizzes. This interactivity significantly enhances user engagement and increases dwell time, which can positively impact your SEO efforts.
How often should I create infographics?
There isn't a fixed rule for infographic creation frequency, but consistency is a key factor. Producing infographics quarterly or semi-annually can be an effective starting point for most businesses to maintain a fresh content pipeline. The optimal frequency should align with your overall content strategy, resource availability, and your audience's appetite for visual content.
Do infographics directly increase sales?
While infographics do not directly increase sales in the same way a product page might, they contribute significantly to the sales funnel. They help build brand authority, generate leads by attracting organic traffic and backlinks, increase brand awareness, and educate potential customers. All these benefits indirectly lead to higher conversion rates over time.
Conclusion: Master the Art of SEO Infographics
SEO infographics represent a powerful blend of engaging visuals and strategic optimization. They provide a unique way to capture audience attention and improve search engine rankings. By adopting a comprehensive approach encompassing detailed keyword research, striking design, strong on-page optimization, and focused promotion, businesses can transform intricate information into shareable assets that attract substantial organic traffic and build authority.
As the digital landscape continues to evolve with advancements in AI and AR, the future of infographics looks even more dynamic and personalized. By keeping up with current trends and continually refining your strategies, you can harness the power of SEO infographics to boost your online visibility, engage your audience effectively, and achieve your broader marketing goals.
References
[1] HubSpot. "The Ultimate List of Marketing Statistics for 2024." HubSpot Blog, 2024. Link
[2] Neil Patel. "How Interactive Content Boosts SEO and Engagement." NeilPatel.com, 2023. Link
[3] Statista. "Augmented reality (AR) and virtual reality (VR) market size worldwide from 2017 to 2028." Statista, 2024. Link
[4] Purdue Online Writing Lab (OWL). "Citing Sources." Purdue OWL, 2024. Link
Continue in Recap
Turn this source into a Recap Document
Make it easier to read, then send time-based details to Calendar, export it to Workspace, or start PBL Learning.