
Source to document
Turn a source into a readable document
Recap organizes material you already have into a structured document that is easier to read, judge, and use.
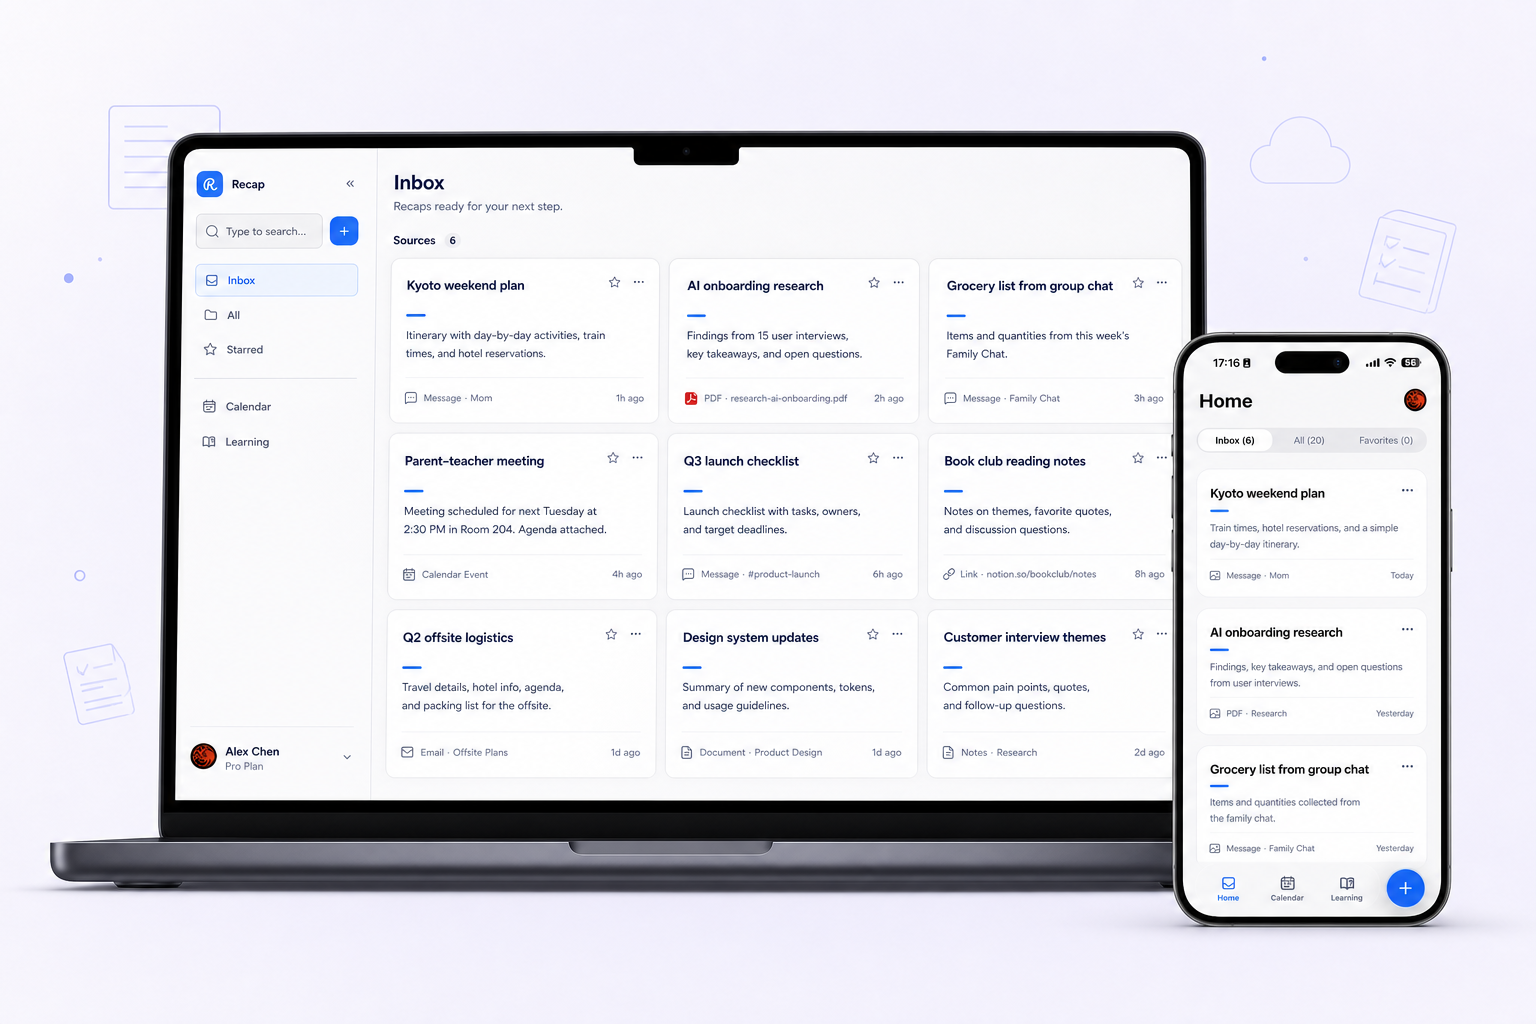
What it helps with
A clearer way to inspect the material.
- Separate key points from supporting detail
- Choose the document mode that fits the source
- Keep Calendar, Workspace, and Learning ready as next steps
Keep the boundary clear
What it does not do
Recap does not replace your calendar, notes app, workspace, or task manager.
Bring in
Sources you already have.
- Webpages
- PDFs and documents
- Images
- YouTube videos
- Presentations
Recap Document
A document mode that fits the source.
- Action
- Decision
- Understanding
- Reference
How it works
From source to a useful next step.
- 01
Bring in one source
Add a webpage, document, image, YouTube video, or presentation to Recap.
- 02
Read the Recap Document
Recap organizes the source into an Action, Decision, Understanding, or Reference document.
- 03
Choose the next step
Send time-based details to Calendar, export the document to Workspace, or start PBL Learning.
Keep exploring
More ways to work with a source.
Recap tool
Text Simplifier
Make dense source material easier to understand by turning it into a structured readable Recap Document.
Open toolRecap tool
Screenshot to Calendar
Turn time-based details in a screenshot into a reviewable Calendar Sheet before sending them to your calendar.
Open toolRecap tool
Source to Workspace
Turn a source into a structured Recap Document and export it to the notes or workspace tools you already use.
Open toolFrom the journal
Read the deeper guide.
Guides and Tutorials
How to Organize Information From Screenshots, Links, and PDFs
Use a practical intake method for screenshots, links, and PDFs. Keep source context, mark uncertainty, and merge mixed formats into usable notes.
Guides and Tutorials
The Source-Grounded Document Quality Checklist
Use a five-pass source-grounded document checklist to verify traceability, scope, gaps, structure, and reviewable next steps.
Guides and Tutorials
From Raw Source to Structured Document: The Practical Guide
Learn how to turn screenshots, links, PDFs, and messages into source-grounded structured documents with clear modes, evidence, and next steps.
Guides and Tutorials
Structured Notes vs. a Summary: Which Result Do You Need?
Compare structured notes and summaries with a simple decision matrix for review, action, reuse, source verification, and deeper learning.
FAQ
Questions before you start.
Ready when you are